
I file CSVacronym for Comma-Separated Values (in Europen “comma separated values”), are a format commonly used to store tabular data in a structured and readable way both by humans and computers. These files are widely used in a wide range of applications, including spreadsheetsdata analysis software, for importing into databases and much more.
The data is divided into rows and columns: drawing an analogy with a database, in a CSV file each row actually represents a record while the columns contain the various fields. A CSV is a text file where the data is separated by a delimiter, which is often a comma, but can also be a semicolon, tab, or other character. This delimiter signals the boundary between the contents of the various data columns. It is obviously advisable to choose the delimiter carefully to prevent its use within the CSV from being erroneously interpreted.
These file types are widely used because they have the advantage of being universally compatible: They are supported by a wide range of applications, including spreadsheet applications such as Microsoft Excel e LibreOffice CalcOffice Online, Google Workspace, Microsoft 365, ONLYOFFICE, data analysis software like Python with library pandas and so on.
Learn to process CSV with a European Central Bank file
The European Central Bank (ECB) publishes and updates daily a file with the exchange rates of the euro (EUR) against other currencies. This data is made available precisely as a CSV file contained within a compressed archive in Zip format.
A simple Zip file containing a CSV file seems almost insignificant at first glance: in reality a huge amount of financial applications uses the ECB file every single day.
The creators of the project csvbasehave published a very interesting post in which they explain how their tool and simple commands given from the Linux terminal window allow you to transform CSV files in a database and to extract useful information for your activities from a series of initial data that is difficult to interpret and manage.
Assuming you have installed curl, SQLite and Python (possibly also gnupilot e DuckDBsee below) in the Linux distribution that is usually used (for this purpose you can also use the WSL bash interface in Windows, Windows Subsystem for Linux), the developers of csvbase invite you to issue the following commands:
curl -s https://www.ecb.europa.eu/stats/eurofxref/eurofxref-hist.zip \
| gunzip \
| sqlite3 -csv ':memory:' '.import /dev/stdin stdin' \
"select Date from stdin order by USD asc limit 1;"
The symbol of pipe (|) allows you to chain multiple commands and run them one after the other.
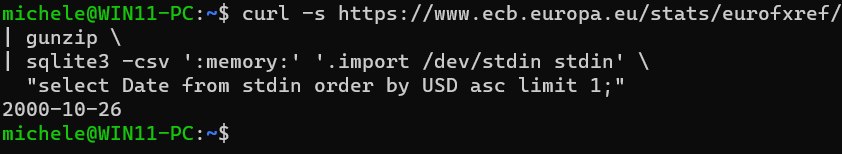
The first command curl downloads the data from the ECB servers with the compressed archive which is then subsequently “unzipped“. Finally, the command sqlite3 queries the CSV file contained in memory and extracted from the ECB servers and then loads its contents into a table called stdin. The final string matches one query SQL SELECT which extracts the date on which, at the exchange rate, the dollar was stronger than the euro.
The great thing is that the ECB CSV file contains more than 6,300 values: in an instant it is possible to extract what interests you by drawing directly on the contents of memory.
Cleaning and melting a CSV file: what it means
When working with a file in CSV format, it may happen that the data does not have the structure which is of interest and which simplifies subsequent processing. From csvbase it is explained that with simple interventions from the command line, you can easily get what you want.
The CSV file produced by the ECB is probably one of the cleanest and best structured that can be found around today. Yet there is aimperfection: at the bottom of each line there is a superfluous delimiter (comma) which shouldn’t be there. The developers of csvbase have the following code:
curl -s https://www.ecb.europa.eu/stats/eurofxref/eurofxref-hist.zip | \
gunzip | \
python3 -c 'import sys, pandas as pd
pd.read_csv(sys.stdin).iloc[:, :-1].melt("Date")\
.to_csv(sys.stdout, index=False)'
The code provided performs a series of operations to download, decompress and manipulate the ECB CSV with historical data on the exchange rates of various currencies.
In the example the command python3 launches an instance of Python and runs a short script that first imports the module sys to access system features and pandas for data manipulation.
Con pd.read_csv(sys.stdin) you read the CSV data from the standard input (the output of the command gunzip containing the decompressed data) and handled as a pandas DataFrame.
To eliminate the trailing comma present in each line the Python script uses .iloc[:, :-1] which precisely forces the removing the last column dal DataFrame.
Request data melting: what it is
The Python script provided by csvbase also carries out another important operation, namely the melting of CSV data. This is a widely used concept in data analytics.
It is a technique that allows you to transform a data structure from a shape”wide” (long) to a form “long” (long), making the analysis and visualization of the data easier. Suppose we have a dataset in forma “wide” which represents the average monthly temperatures of three cities for several years:
| Anno | City_A | City_B | City_C |
|---|---|---|---|
| 2020 | 22.5 | 23.0 | 21.2 |
| 2021 | 23.1 | 24.5 | 22.9 |
| 2022 | 22.7 | 23.8 | 21.5 |
Il melting in this case it can be used to obtain a historical series of data in format long:
| Anno | City | Medium temperature |
|---|---|---|
| 2020 | City_A | 22.5 |
| 2020 | City_B | 23.0 |
| 2020 | City_C | 21.2 |
| 2021 | City_A | 23.1 |
| 2021 | City_B | 24.5 |
| 2021 | City_C | 22.9 |
| 2022 | City_A | 22.7 |
| 2022 | City_B | 23.8 |
| 2022 | City_C | 21.5 |
With this approach, each row represents a specific combination of year, city, and average temperature. This is a representation that simplifies data analysis, for example, to calculate the average annual temperature for each city or to visualize the data in scatter plots.
Melting on the ECB CSV file
It’s kind of the same case as the example of the value of exchange rates: the developers of csvbaseusing the script presented above, have generated a data sequence consisting of 260,000 records that offers an “explorer” of the trends of each currency day after day since the early 1990s.
The “magic” lies in the use of method .melt("Date")a function that performs the operation of melting to get a DataFrame in shape wide. In each row you get a first column with the date, a second with the currency identifier and a third with the exchange rate.
Lastly, .to_csv(sys.stdout, index=False) convert of new data resulting in CSV format sending them to standard output (sys.stdout). The option index=False prevents the row index from being written to the resulting CSV file.
csvbase: what it is and how it works
csvbase is a simple web database management system designed for interacting and manipulating tabular data in CSV format. Available as an open source project on GitHub, csvbase offers an intuitive web interface that allows users to view, add, edit, and delete rows within data tables directly from a browser. This ease of use makes csvbase accessible even to those who are not programming experts and who do not know SQL inside out.
With the browser-accessible tool, users can export table data in various formats, including CSV, XLSX and more. Every table csvbaseFurthermore, it has a single URL: the tool use the scheme RESTfulwhere each data table has a single URL that can be called using HTTP protocol “verbs”.
For example, with HTTP PUTyou can create a new table or overwrite an existing one with other data; with HTTP DELETE delete an existing table; with HTTP POST add new rows of data in bulk to a pre-existing table.
csvbase It is compatible with several data analysis tools and programming languages, including pandas, Apache Spark, R, DuckDB and any other tools it can perform HTTP requests. This makes it easy to integrate the data managed by csvbase into your analysis or processing activities.

Create graphs from CSV with gnuplot and DuckDB
After loading the result of the melting are csvbase with the command curl -n --upload-fileyou can for example use this script (again proposed by Cal Paterson) to obtain a graph:
curl -s https://csvbase.com/calpaterson/eurofxref-hist | \
grep USD | \
cut --delim=, -f 2,4 | \
gnuplot -e "set datafile separator ','; set term svg; \
set...